Table of contents
A data center developer usually has three things before ground breaks: a site, a power position, and a set of engineering drawings. What they do not have is the one thing anchor tenants and capital partners commit against—a facility they can see, walk, and believe in. A CAD model proves the building works. It does not make a hyperscaler’s real estate committee or an investment committee move before the slab is poured.
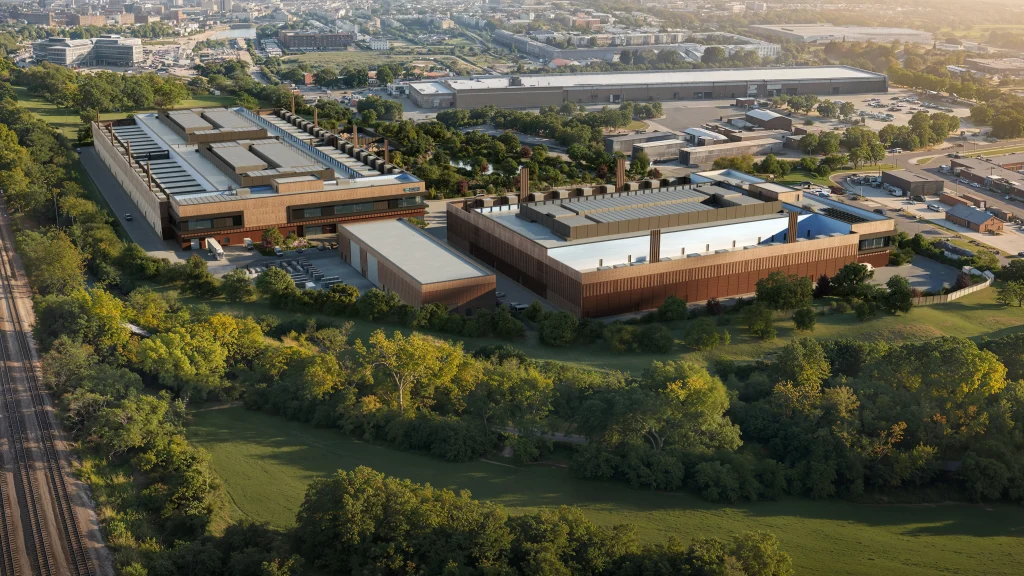
3D data center visualization is the use of photoreal CGI, cinematic animation, and interactive real-time walkthroughs to present a data center campus before it is built. In the pre-construction context, it is a leasing and investment asset—the tool that helps developers pre-lease capacity and reach financial close, not an operations dashboard.
That distinction is the whole point of this guide, because almost everything that ranks for “3D data center visualization” means the opposite thing.
What Is 3D Data Center Visualization, and How Is It Different From a DCIM Monitoring View?
3D data center visualization has two meanings that share a name. One is pre-construction visualization: photoreal imagery and interactive walkthroughs built to lease and finance a facility that does not exist yet. The other is operational visualization: a live 3D view of a running building’s power, cooling, and rack capacity.
Most search results describe the second meaning. Tools like Sunbird DCIM and EkkoSense render an interactive health map of a facility already in operation—thermal load, airflow, power draw, capacity per cabinet. That is data center infrastructure management, and it is genuinely useful for the teams running a live site.
It is also the wrong tool for a developer who has not broken ground. Before construction, there is no live building to monitor. There is a leasing target, a financing deadline, and a set of tenants and investors who need to understand the facility years early. That job belongs to pre-lease visualization, and the SERP barely covers it.
| Operational visualization (DCIM) | Pre-lease visualization (marketing) | |
|---|---|---|
| Purpose | Monitor and manage a live facility | Lease and finance a facility before it is built |
| Primary users | Facility, operations, and capacity teams | Anchor tenants, capital partners, the leasing team |
| What it shows | Power, cooling, airflow, rack capacity | The campus, the powered shell, the tenant suite, the site story |
| When it is built | After the building is operational | Before ground breaks |
| Underlying tech | DCIM sensors, CFD, live telemetry | CGI, cinematic film, real-time engine walkthrough |
| Example providers | Sunbird, EkkoSense, ManageEngine | CGI and pre-lease visualization studios |
Both are “3D data center visualization.” Only one closes a lease.
Why Do Data Center Developers Need Visualization Before Construction?
Because the commitments that make a project bankable happen before the building exists. Hyperscale and colocation capacity is pre-leased years ahead of delivery, North American vacancy sits at a record low, and first-half 2026 absorption reached a record 25 GW(JLL, 2026). Supply cannot keep up with demand. The developer who can show the facility earliest wins the anchor tenant earliest.
Pre-leasing is not only a sales milestone. It is how a site reaches financial close. Reserving space and power through an early lease is what converts a land-and-power position into a financeable asset, and the lease structure is negotiated long before commissioning, whether turn-key, powered shell, or build-to-suit Every one of those conversations goes better when the tenant and the lender can see what they are committing to.
The capital at stake makes the case sharper. US data center construction put-in-place spend is running near $85.3 billion in 2026, roughly 1.9 times the 2024 figure(Archdesk, 2026), with monthly construction starts hitting $22.3 billion in August 2026, the second highest on record(ConstructConnect, 2026). On AI-native builds, cost per megawatt has climbed from about $7 million in 2020 to $11–20 million in 2026(Archdesk, 2026). At that scale, the months a visualization shaves off pre-leasing are worth more than the visualization itself.
The financing case runs deeper than the construction loan. A signed anchor lease is the security behind the whole capital stack: it underwrites construction debt and joint-venture equity, and it increasingly backs the bond market, where data center asset-backed securities have grown roughly sixfold, from $2.4 billion in 2020 to $15.5 billion in 2025, prompting the SEC to ease securitization rules for the asset class in 2026(Bloomberg via Yahoo Finance, 2026). Those bonds are backed by long-term leases to a small set of investment-grade tenants, which makes the lease itself the product. Anything that helps a developer sign it sooner compounds through every layer of the capital stack above it, and an experiential asset a tenant’s credit committee can evaluate before the building exists is built to do exactly that.
Why Do Most Operators Get Pre-Construction Visualization Wrong?
They treat it as an engineering deliverable instead of a leasing asset. A BIM export or a gray massing model answers an engineer’s question – does the building fit, does the power route work. It does not answer the tenant’s question, which is whether their workload belongs here, or the investor’s question, which is whether this team can deliver the campus they are drawing.
The second mistake is fragmentation. A developer who hires a CGI studio for renders, a web agency for the leasing site, and a brand designer for the identity ends up with three vendors, three timelines, and three visual languages. The campus render does not match the walkthrough, the walkthrough does not match the site, and the story a tenant sees in the pitch is not the story on the developer’s website. Coordination time is the tax, and it is paid on the financing clock.
The fix starts before any pixel is produced. Position the site first—who the target tenant is, what the power and connectivity story is, why this campus beats the alternative on the tenant’s shortlist. Visualization carries that position; it cannot invent one. The strongest pre-lease assets read as made for one specific tenant and one specific investor, because the positioning was settled before the render was framed.
How Does 3D Visualization Help You Pre-Lease and Fund a Site?
It gives each audience a version of the facility they can evaluate before it exists. An anchor tenant walks their future suite. A capital partner sees the campus at full scale. The leasing team carries one consistent asset from the first meeting to the signed lease, so the argument never resets.
A data center site sells to more than one room, and each room weighs a different thing. Anchor and hyperscale tenants weigh fit – power, cooling readiness, connectivity, and whether the suite matches their deployment. Capital partners and infrastructure investors weigh delivery risk – the team, the site, and the plan. The internal deal team weighs momentum. A single visualization set speaks to all three when it is built to, and it moves them through a familiar sequence.
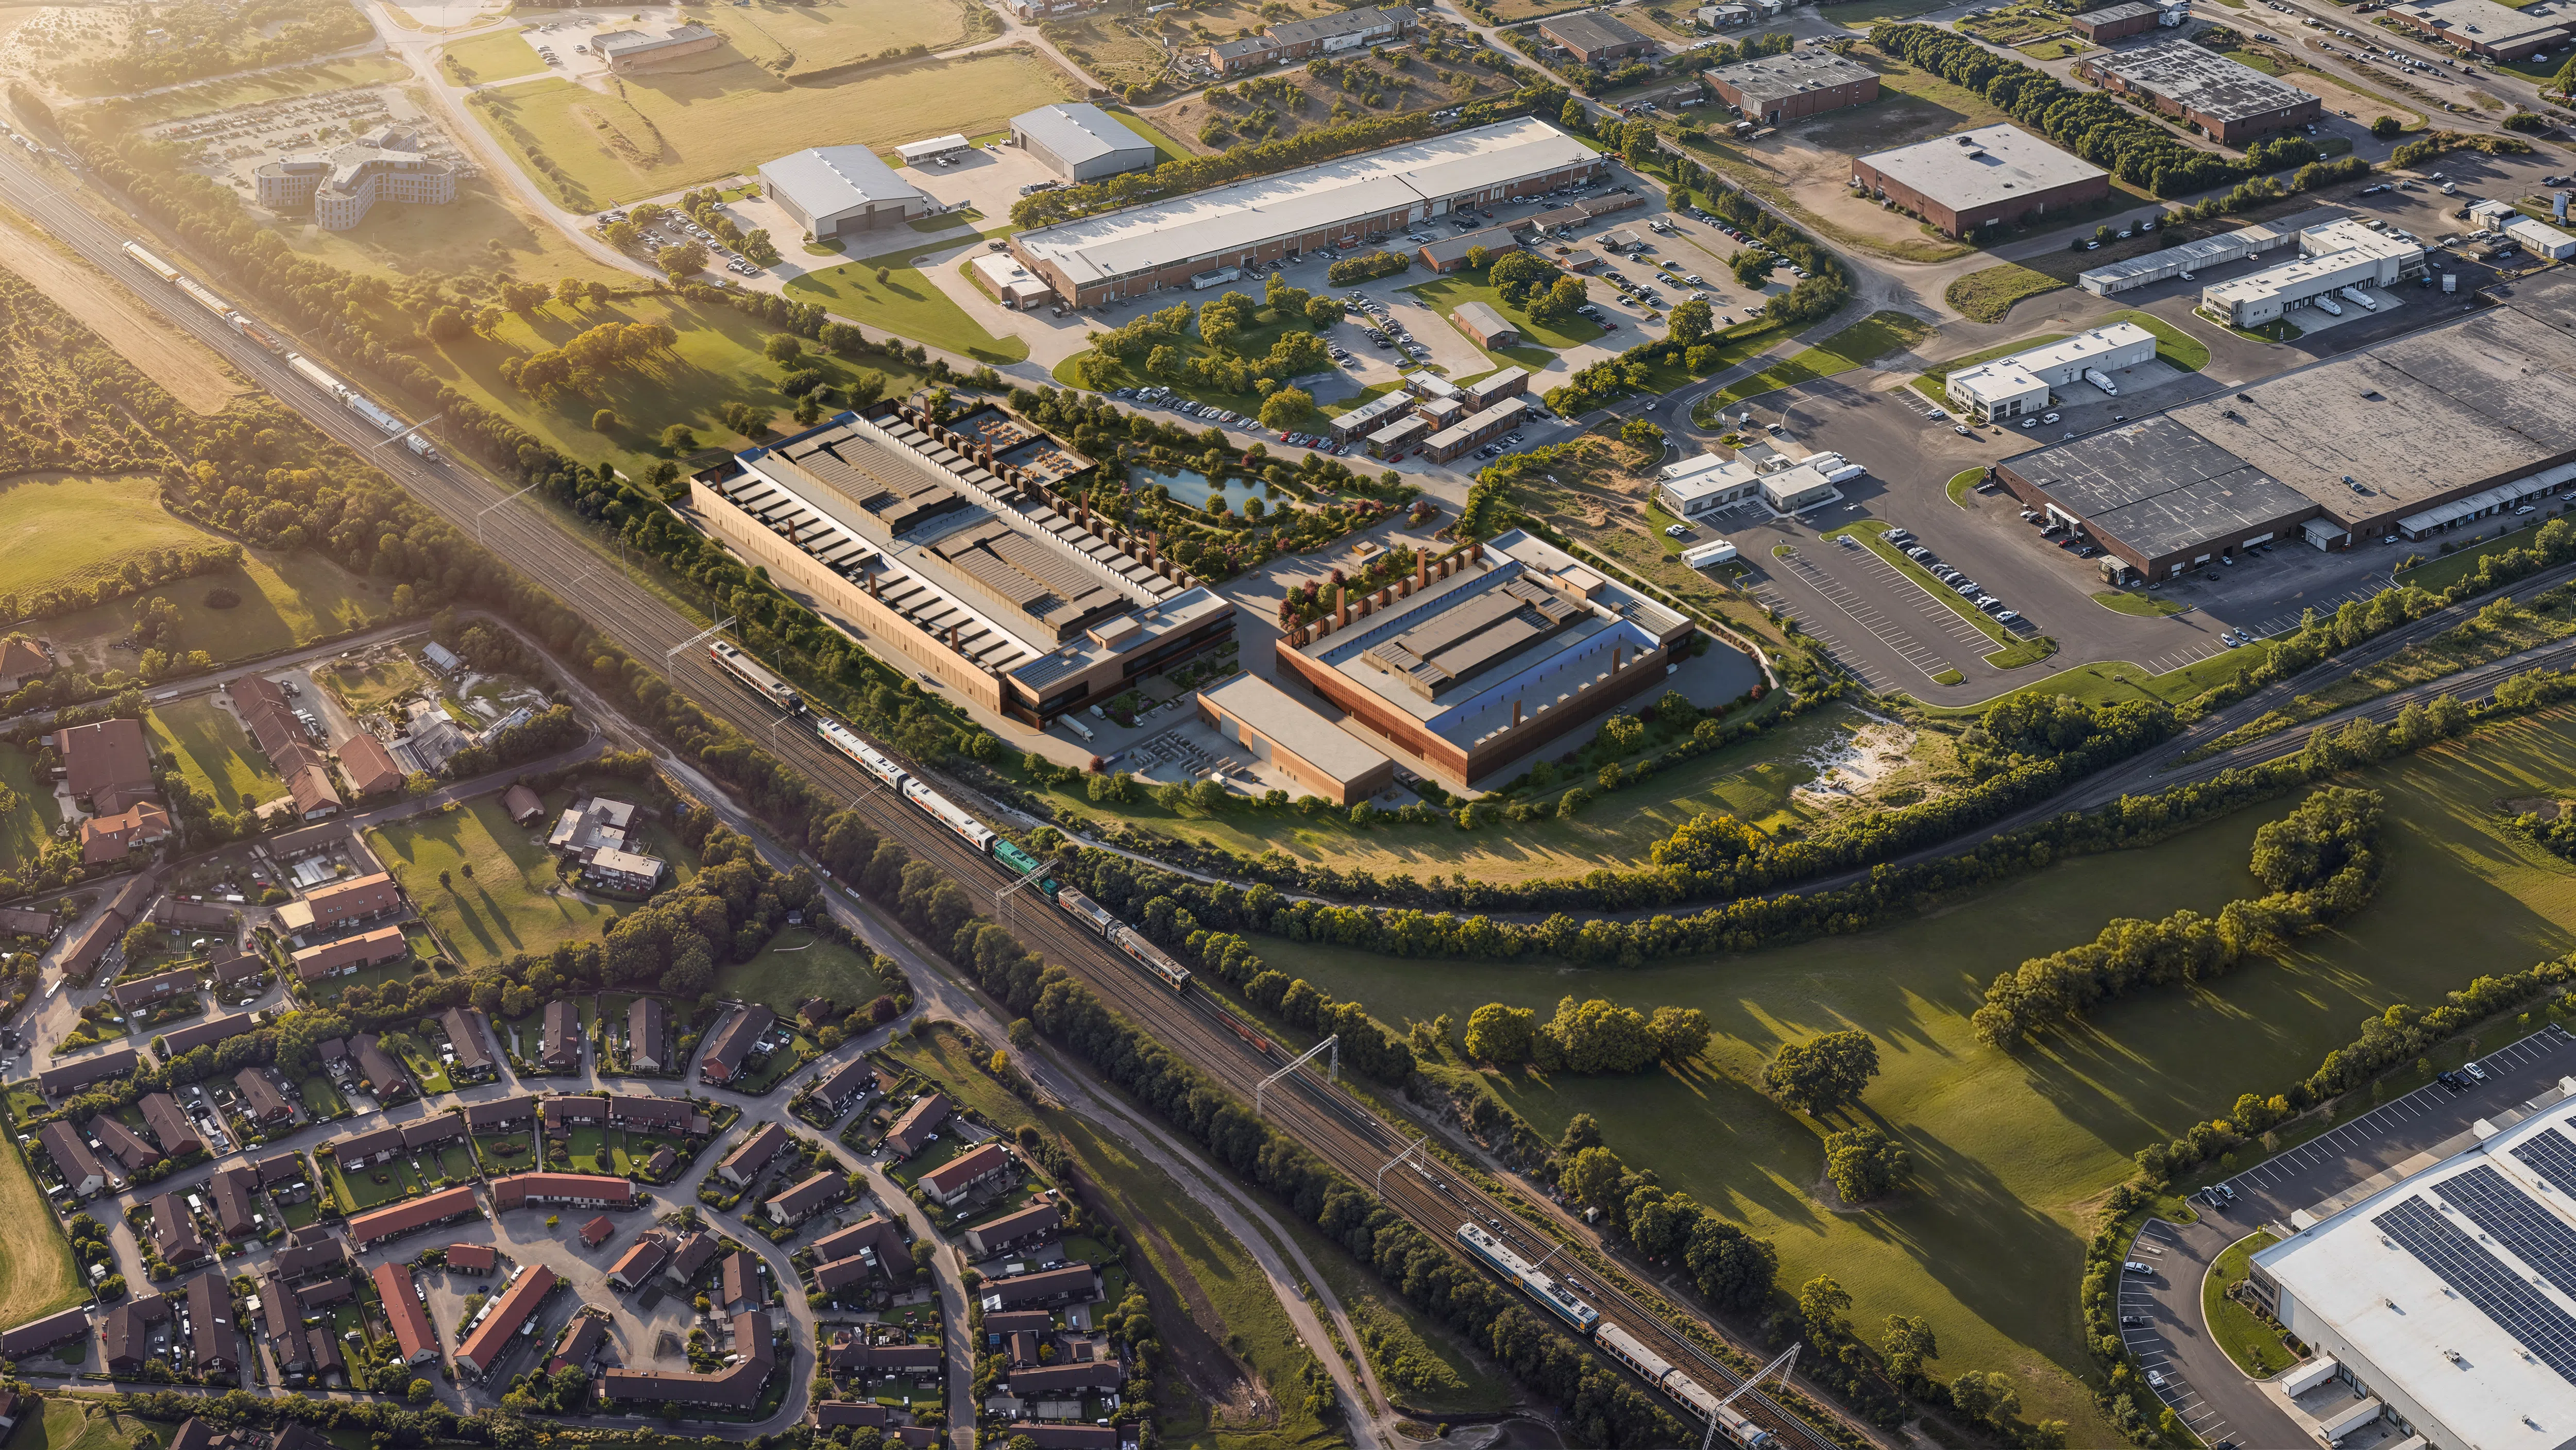
Awareness. The campus against its setting – an aerial of the site, the building at scale, the power and fiber story told visually. A cinematic film opens the first conversation with a tenant or a fund before a single drawing is shared.
Consideration. The interactive walkthrough. A tenant navigates the powered shell and their own suite at real scale, sees the white space, the ceiling heights, the loading and staging, the routes for power and cooling infrastructure. This is the stage where “we think it fits” becomes “we can see it fits.”
Conversion. The digital leasing gallery. Available suites and megawatts, the site plan, capacity, and status on one link the leasing team shares and the tenant’s committee returns to. Tied to a CRM, it shows the developer who is reviewing which suite and how often, so the team knows when a tenant is ready to sign.
There is a reason this works before construction: the visualization becomes physical proof when there is no physical building to show. A tenant cannot tour a facility that is a field and a substation. They can tour the walkthrough. That is the proof that carries the lease while the concrete is still a schedule.
How Do Power, Timing, and Rack Density Change What a Data Center Visualization Must Show?
They shift the burden of proof from the architecture to the infrastructure. A tenant’s site-selection team and a lender underwrite power and timing before aesthetics, so the visualization has to carry the power position (the substation, the interconnection path, the on-site generation), not only a polished exterior. Power delivery, not construction, is the binding constraint, and a 100 MW grid connection can take 7 years in Northern Virginia and roughly 4 years on the national average, against a shell that builds in 18–24 months. A campus visualization that makes a secured-power, ready-to-energize story legible, showing where the power originates, how it reaches the hall, and when it lands, answers the first question a serious tenant or investor asks.
Density raises the stakes again. Average rack power has climbed to about 27 kW in 2026 and is heading toward 40 kW, and AI-native racks already run far higher, with NVIDIA’s newest platform reaching up to 246 kW per rack. Yet only one in five operators say they are ready for the 50–70 kW racks now common in AI deployments. Those densities force liquid cooling, at roughly 19% adoption today, and they reshape the physical hall with direct-to-chip loops, coolant distribution units, and heavier power rooms. An AI tenant will not commit tens of megawatts to a facility it cannot verify supports that envelope, and a still render does not show it. An interactive walkthrough of the AI-ready hall lets the tenant’s deployment engineers read the cooling and power design the project’s own engineers specified, before the first pour.
How Do You Commission a Pre-Lease Data Center Visualization?
Start from position, not pixels. Decide who you are leasing to and what they must believe, then build the assets that carry that argument from the first meeting to a signed lease. The sequence below moves from your existing CAD or BIM to a leasing-ready gallery.
- Position the site. Name the target tenant, the power and connectivity advantage, and the one thing this campus does that its shortlist rivals do not. Every later asset inherits this.
- Hand over your CAD, BIM, and site data. Massing, floor plates, the powered-shell design, and the campus plan are the base geometry. An existing model shortens the build.
- Commission the campus CGI set. Exterior and aerial views, the shell, and representative suite interiors, framed for the pitch deck, the data room, and the website.
- Add a cinematic film. A short piece that opens cold conversations with tenants and investors and sets the tone the rest of the assets hold.
- Build the interactive real-time walkthrough. The experiential model a tenant navigates at real scale, seeing their suite, the white space, and the routes for power and cooling infrastructure, on a screen or in a headset.
- Assemble the digital leasing gallery. Available suites, megawatts, site plan, and status on one CRM-linked link that updates as space commits.
- Deploy across every channel. The developer website, the investor data room, and the leasing team’s kit—one visual language, one source of truth.
Commission it in that order and each asset feeds the next. Commission it out of order, or across three vendors, and you pay to reconcile them later.
What Should Developers Look For in a Data Center Visualization Partner?
One studio that produces the CGI in-house, builds the leasing tools around it, and delivers fast enough to matter to a financing timeline. When the same team makes the renders and the walkthrough, visual consistency is structural rather than a revision cycle, and the campus a tenant sees in the film is the campus they walk in the gallery.
Specialist CGI studios, experiential-media vendors, and branding agencies each do part of this well. For a developer who only needs a set of renders, a CGI-only studio can be the right call. The gap most of them leave is the full pre-lease stack in one place, produced on a financing timeline rather than across three vendors and three schedules.
Three things separate a leasing-grade partner from a render vendor. Speed, because a leasing gallery that lands in weeks reaches tenants inside the financing window, not after it. Range, because a developer who buys renders, a website, and a brand from one studio replaces three vendors and the coordination tax between them. And honesty about scope—a marketing visualization partner builds the leasing and investor layer, not the operational DCIM layer, and should say so plainly rather than imply capabilities it does not hold.
Where Marketing.Fortes Fits: The Pre-Lease Visualization Layer, Built in One Studio
Marketing.Fortes builds the marketing and pre-lease visualization layer as one studio, in-house, so data center developers pre-lease capacity and raise capital before the slab is poured. That layer is photoreal CGI, cinematic animation, and an interactive real-time walkthrough, and it is the one studio that replaces three vendors: a CGI studio, a web agency, and a branding designer.
The mechanism is what makes the speed possible. Because the renders are produced in-house, the digital sales gallery is built directly from them, so the visual consistency between the CGI and the leasing tool is structural, not a coordination cycle. The interactive real-time walkthrough is a true experiential asset, an engine-driven model a tenant or investor navigates before construction, on a screen or in a headset, built for leasing and investor conversations rather than operational monitoring.
On scope, Marketing.Fortes is exact: it builds the experiential and marketing layer, not operational DCIM. There is no CFD, thermal, power, or cooling simulation here—that is the job of the operational tools described earlier, and a data center developer needs both layers for different reasons. What Fortes delivers is the leasing gallery, typically in 5 weeks, produced in-house alongside the renders, the cinematic film, the developer website, and the brand that ties them together into one pre-construction marketing system.
Pricing is scoped to the site. As a reference, campus CGI views typically start around $1,200–$2,500 each, and an interactive real-time walkthrough for a large complex typically runs from about $50,000 into six figures, depending on scope. Exact numbers depend on the campus, the asset set, and the timeline—Get Estimate for a figure against your project.